> ## Documentation Index
> Fetch the complete documentation index at: https://starforge.mintlify.site/llms.txt
> Use this file to discover all available pages before exploring further.
# Dashboard
> Cluster capacity, your quota, and what is running right now.
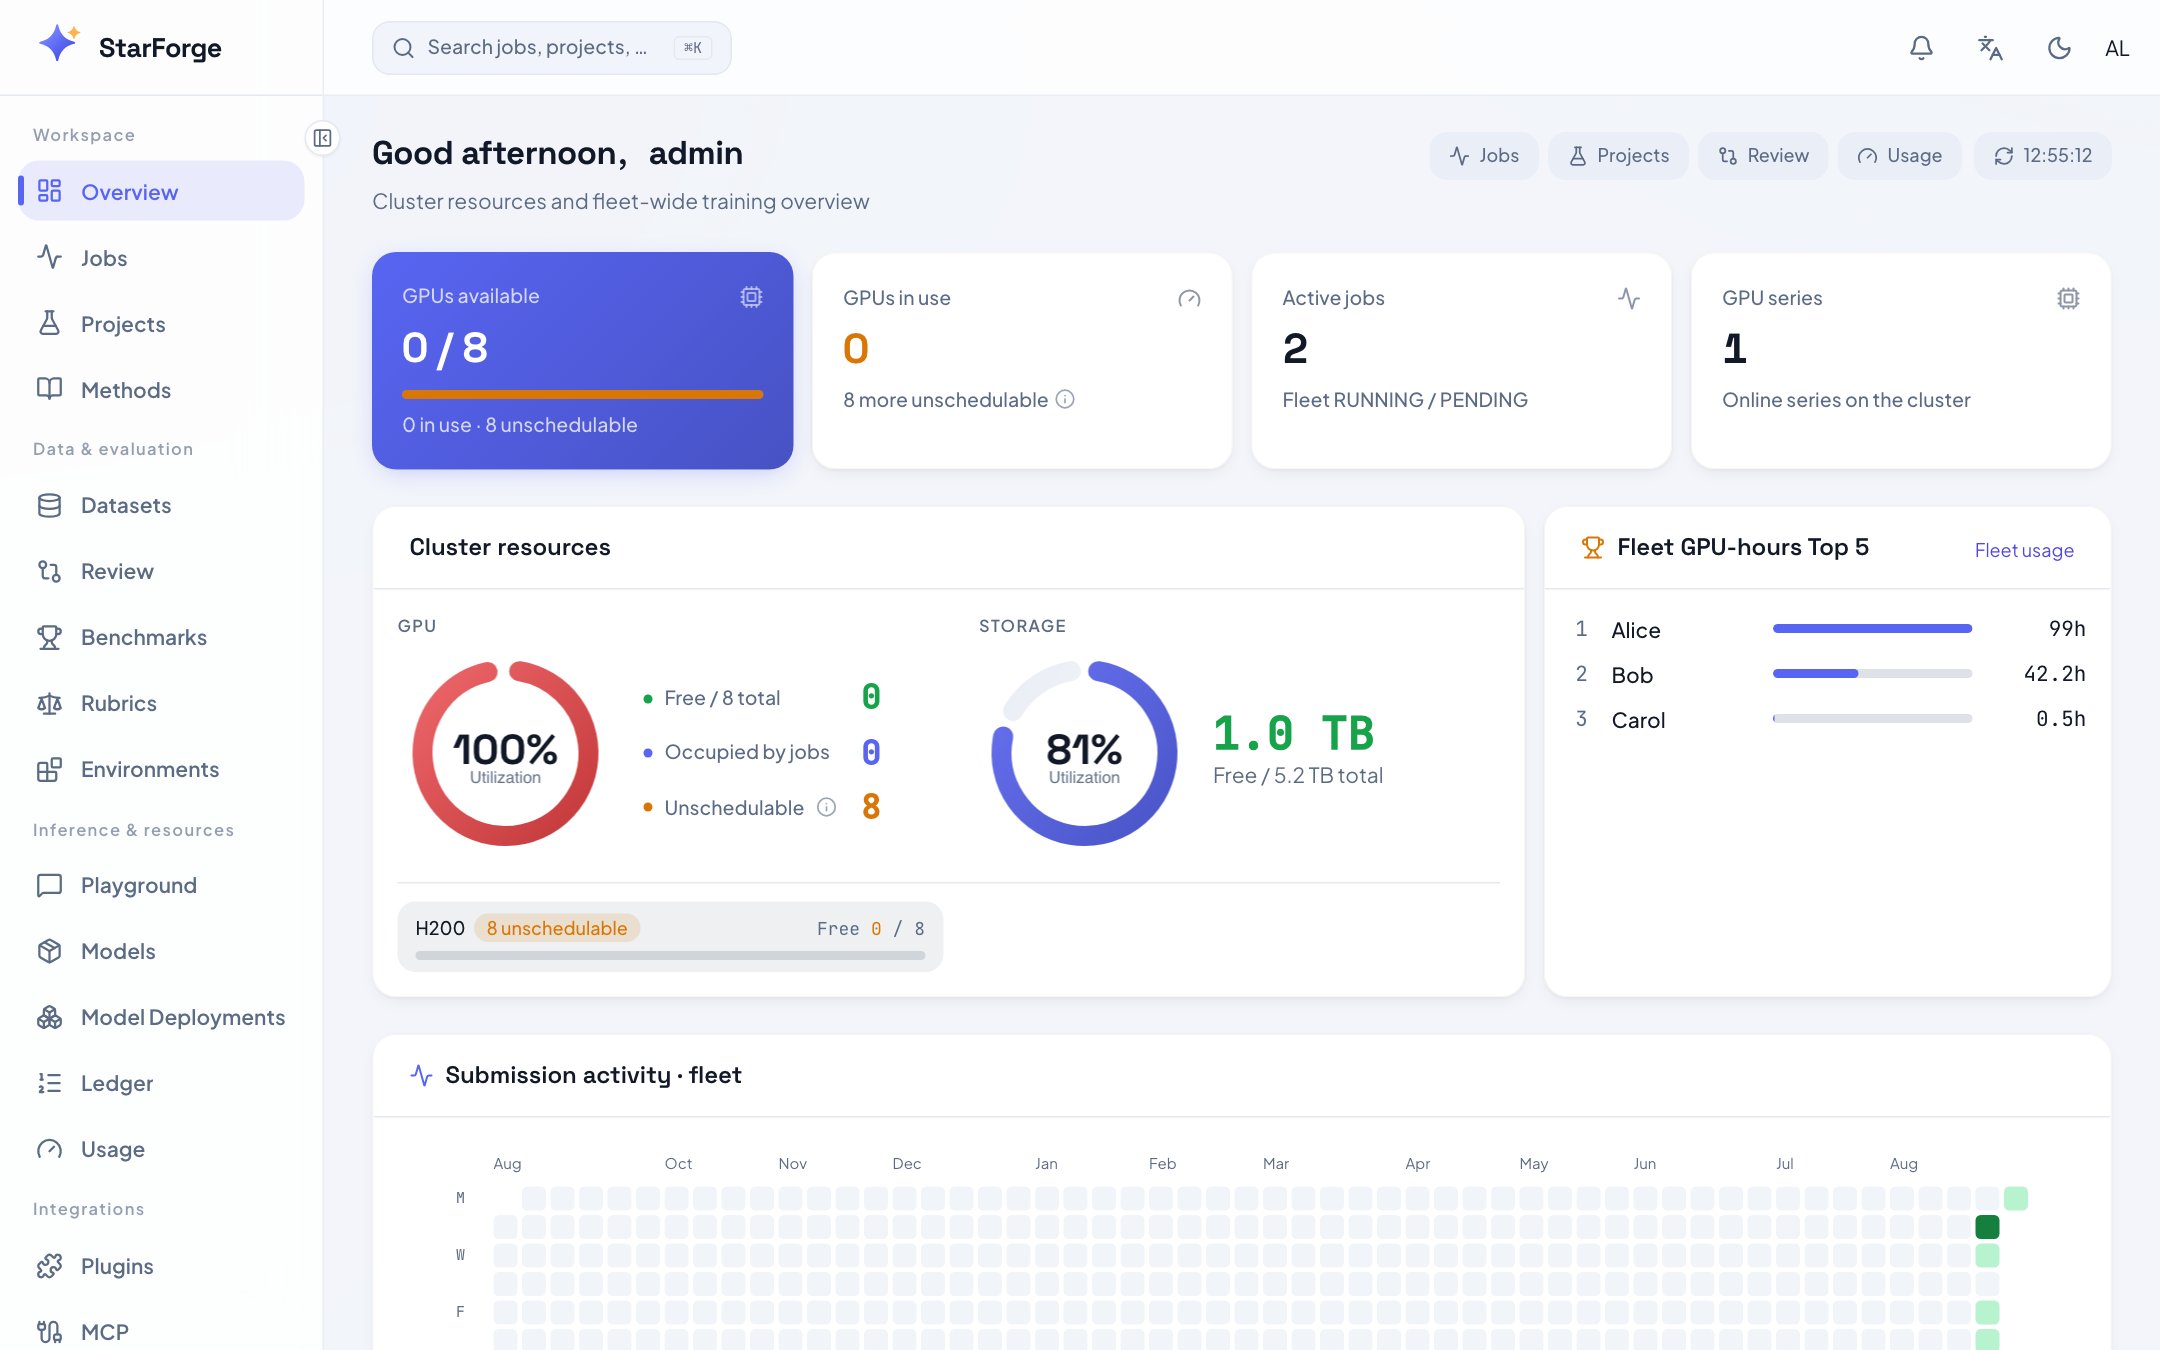
The landing screen. What it shows depends on your role: an administrator sees the fleet, a user sees
their own share of it.
 ## What you see
| Region | What it means |
| ---------------------- | ------------------------------------------------------------------------------------------------------------- |
| **GPUs available** | Free cards per series. `in use` is what running jobs hold; `unschedulable` is cards the platform has excluded |
| **GPU series** | Which series are online. These are the names `--profile` accepts |
| **My concurrent GPUs** | What you are holding against your quota right now |
| **Active jobs** | Everything of yours in RUNNING or PENDING |
| **Recent submissions** | Your last few, newest first |
| **Submission heatmap** | Fleet activity over time, for administrators |
**Unschedulable** is not the same as busy. A card lands there when health checks found pending ECC
retirements or uncorrected errors, or when a process outside the platform is holding it — somebody
who logged into the node and started a notebook. The capacity view says which.
## What you can do
* Click any active job to open its [detail view](/en/console/job-detail).
* Click a series name to see the profiles built on it.
* Follow **Quota and usage** for the longer view: [usage](/en/console/usage).
## When the numbers look wrong
| Symptom | Usually |
| ------------------------------------------- | ----------------------------------------------------------------------------------------------------------------- |
| Free GPUs shown but submissions are refused | A [scheduling window](/en/console/admin-settings) is closed, or your quota is exhausted rather than the cluster's |
| Cards permanently unschedulable | Failing health checks. The capacity view names the reason; the node needs attention |
| No series at all | The hardware registry is empty — an administrator configures it in [settings](/en/console/admin-settings) |
## What you see
| Region | What it means |
| ---------------------- | ------------------------------------------------------------------------------------------------------------- |
| **GPUs available** | Free cards per series. `in use` is what running jobs hold; `unschedulable` is cards the platform has excluded |
| **GPU series** | Which series are online. These are the names `--profile` accepts |
| **My concurrent GPUs** | What you are holding against your quota right now |
| **Active jobs** | Everything of yours in RUNNING or PENDING |
| **Recent submissions** | Your last few, newest first |
| **Submission heatmap** | Fleet activity over time, for administrators |
**Unschedulable** is not the same as busy. A card lands there when health checks found pending ECC
retirements or uncorrected errors, or when a process outside the platform is holding it — somebody
who logged into the node and started a notebook. The capacity view says which.
## What you can do
* Click any active job to open its [detail view](/en/console/job-detail).
* Click a series name to see the profiles built on it.
* Follow **Quota and usage** for the longer view: [usage](/en/console/usage).
## When the numbers look wrong
| Symptom | Usually |
| ------------------------------------------- | ----------------------------------------------------------------------------------------------------------------- |
| Free GPUs shown but submissions are refused | A [scheduling window](/en/console/admin-settings) is closed, or your quota is exhausted rather than the cluster's |
| Cards permanently unschedulable | Failing health checks. The capacity view names the reason; the node needs attention |
| No series at all | The hardware registry is empty — an administrator configures it in [settings](/en/console/admin-settings) |