> ## Documentation Index
> Fetch the complete documentation index at: https://starforge.mintlify.site/llms.txt
> Use this file to discover all available pages before exploring further.
# Jobs Page
> Job list and details: charts, logs, validation samples, system monitoring, AI diagnostics
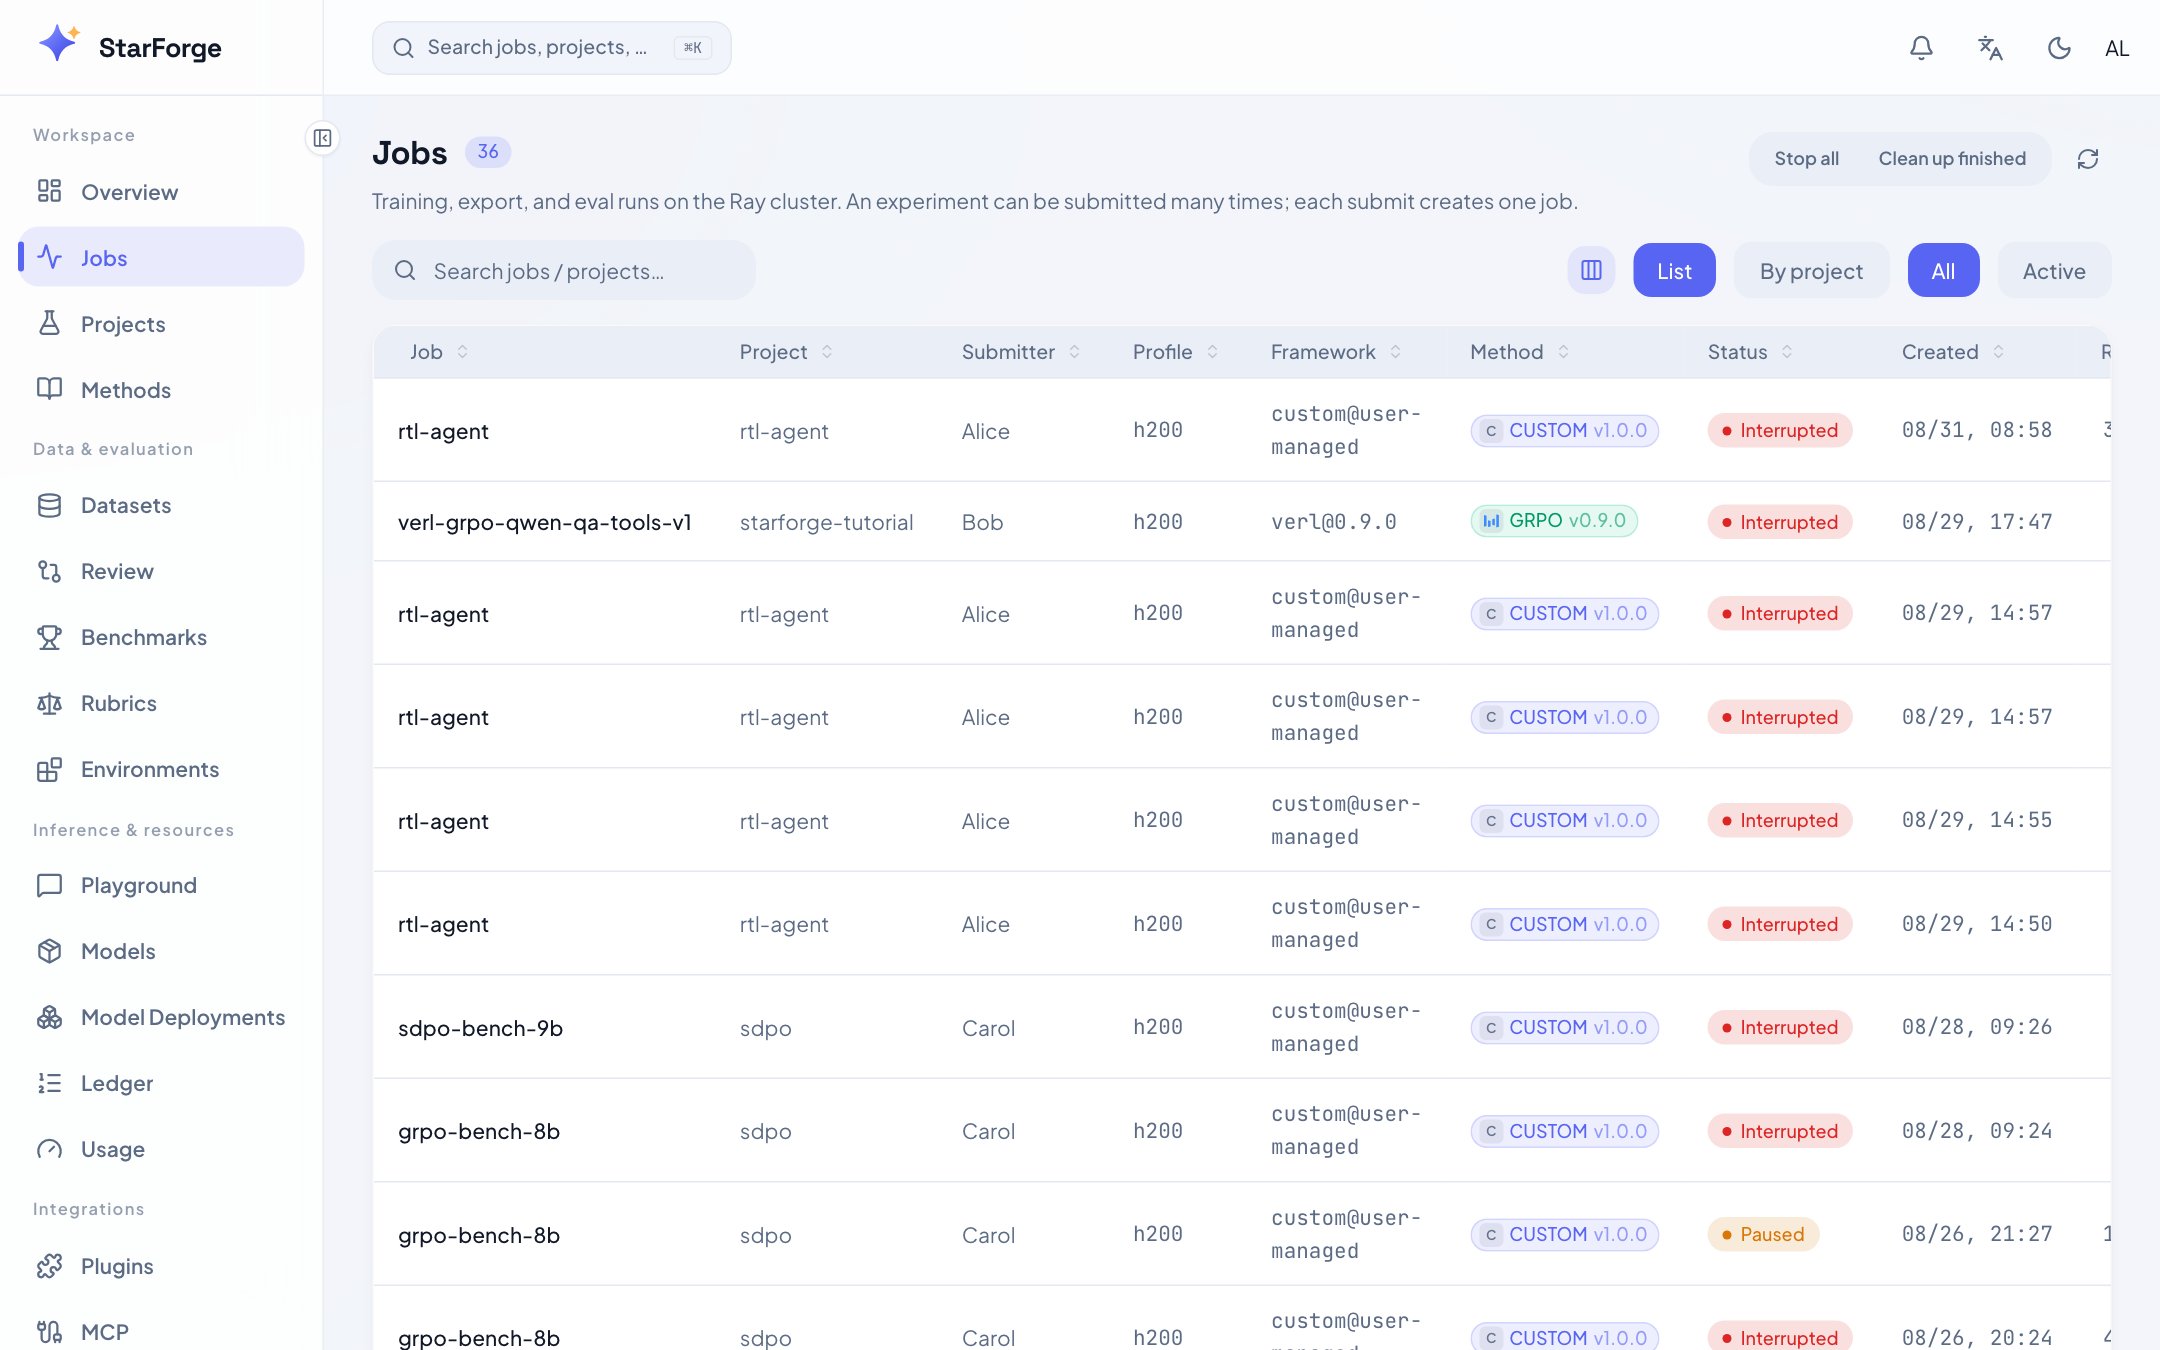
## Job list (/jobs)
Real-time view of all jobs: status, method, GPU count, duration, retry count, sweep badges. Filter by status / user / project. Inline actions: stop, pause, resume, delete.
 ## Job details
Click into any job to see six tabs:
### Charts
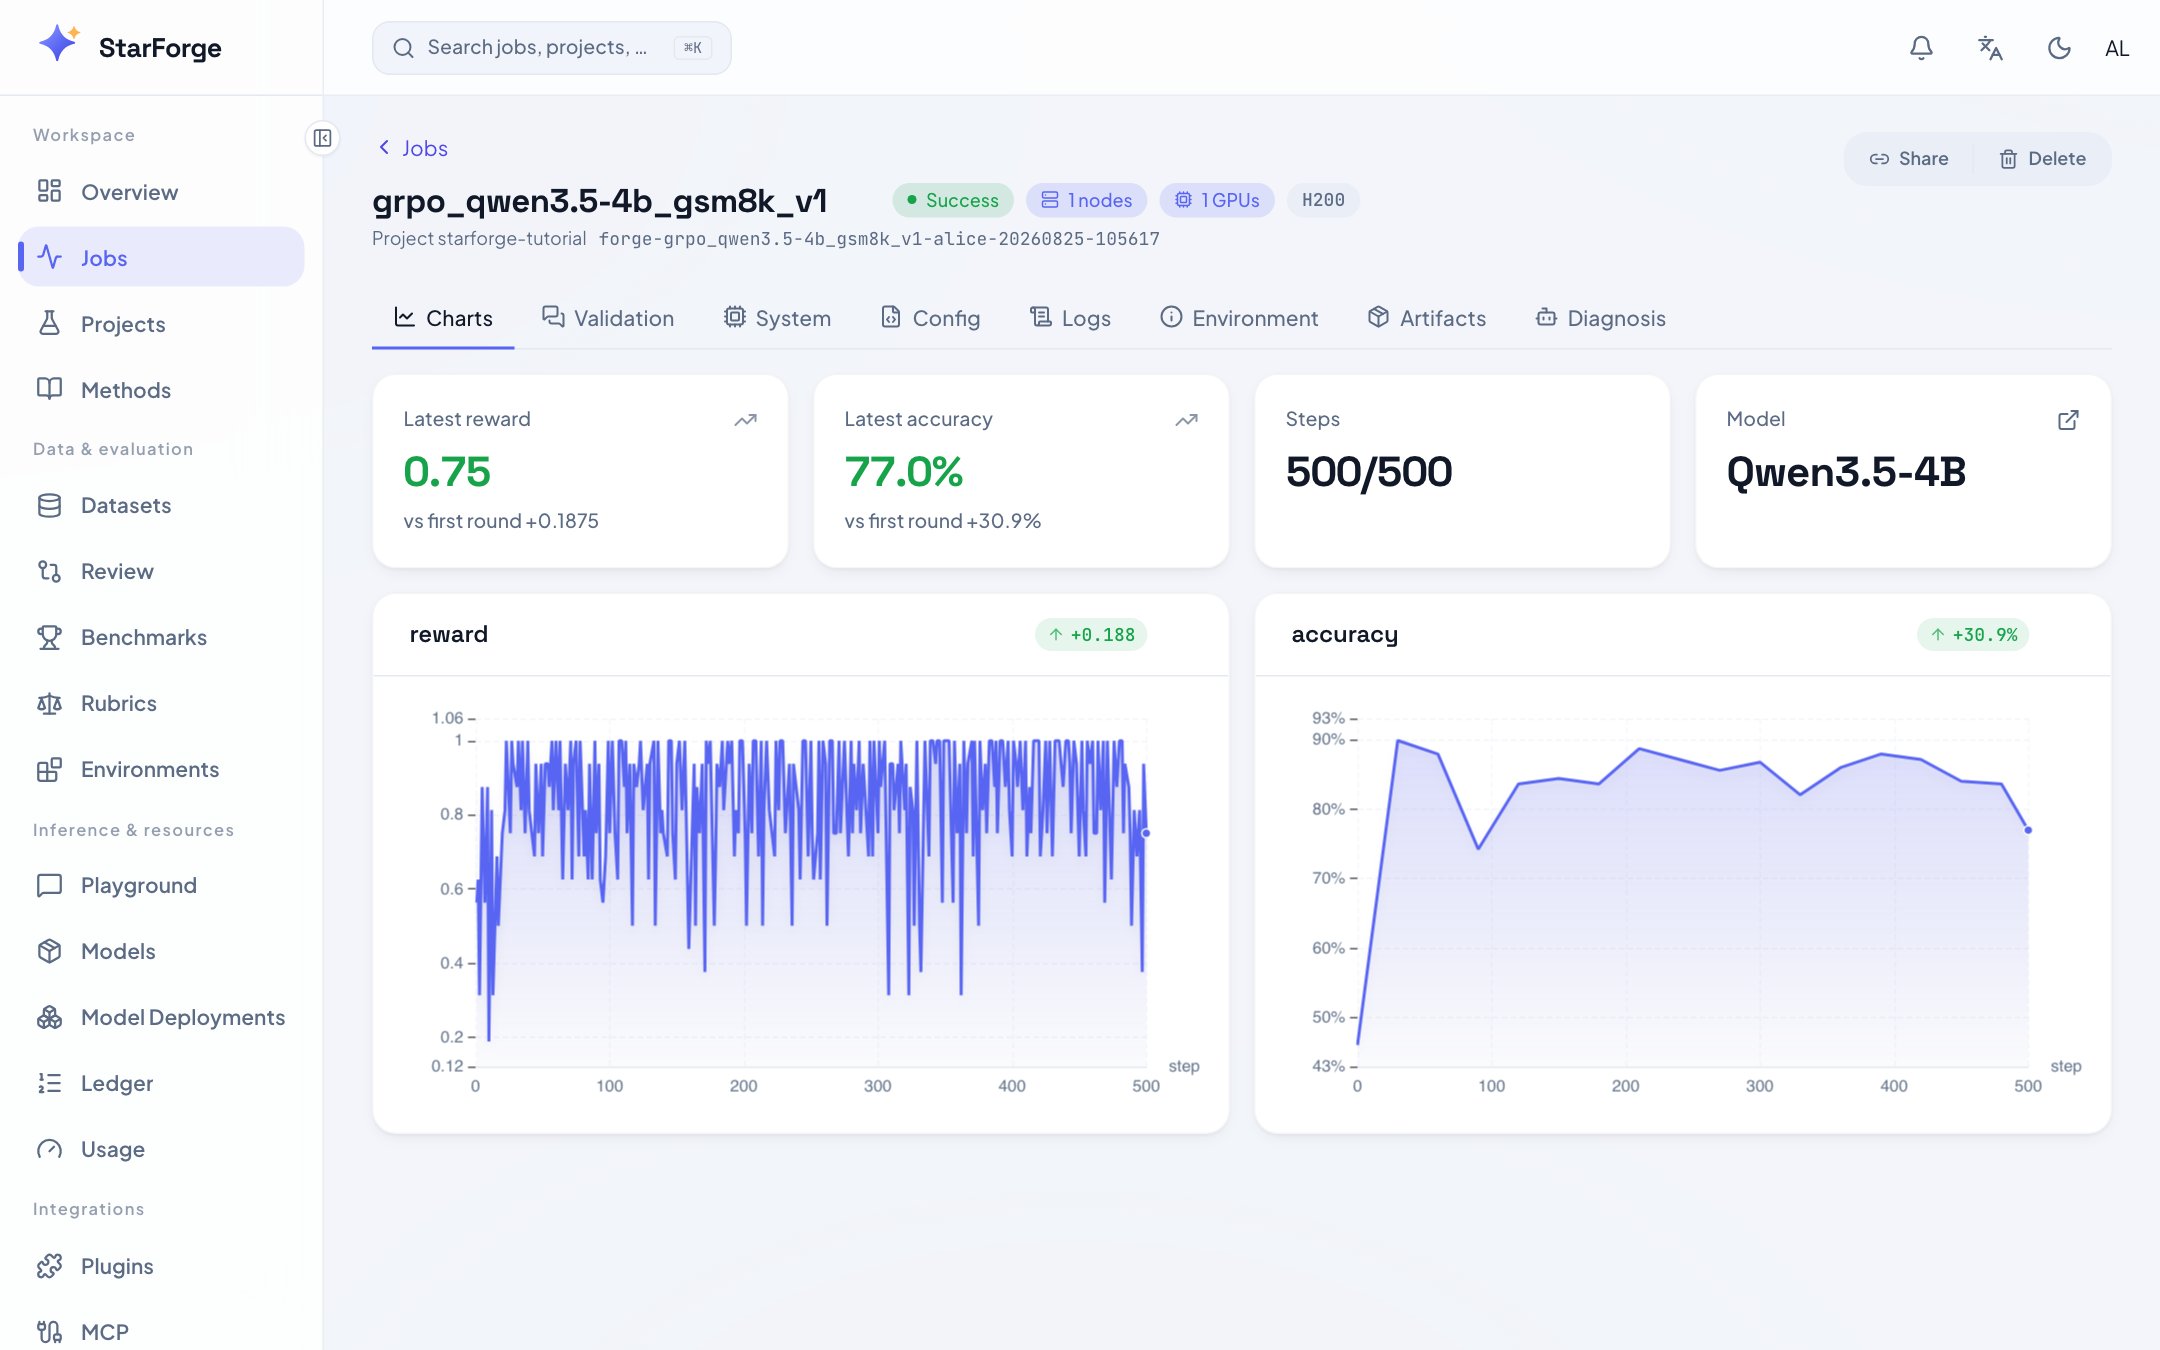
Training scalar time series: loss, reward, KL, gradient norm, learning rate… Features:
* Width-adaptive downsampling (LTTB), so large runs stay smooth;
* Step-window zooming and incremental refresh (new points appended every few seconds while running);
* Metric alias normalization (`train_loss` / `loss` displayed as one source);
* Pin charts to the first slots in their group; pin order is stored per project in this browser and reused across that project's runs;
* CSV export.
Environment custom metrics (e.g. `env/tool_success_rate`) are displayed alongside training scalars from the same source.
## Job details
Click into any job to see six tabs:
### Charts
Training scalar time series: loss, reward, KL, gradient norm, learning rate… Features:
* Width-adaptive downsampling (LTTB), so large runs stay smooth;
* Step-window zooming and incremental refresh (new points appended every few seconds while running);
* Metric alias normalization (`train_loss` / `loss` displayed as one source);
* Pin charts to the first slots in their group; pin order is stored per project in this browser and reused across that project's runs;
* CSV export.
Environment custom metrics (e.g. `env/tool_success_rate`) are displayed alongside training scalars from the same source.
 ### Logs
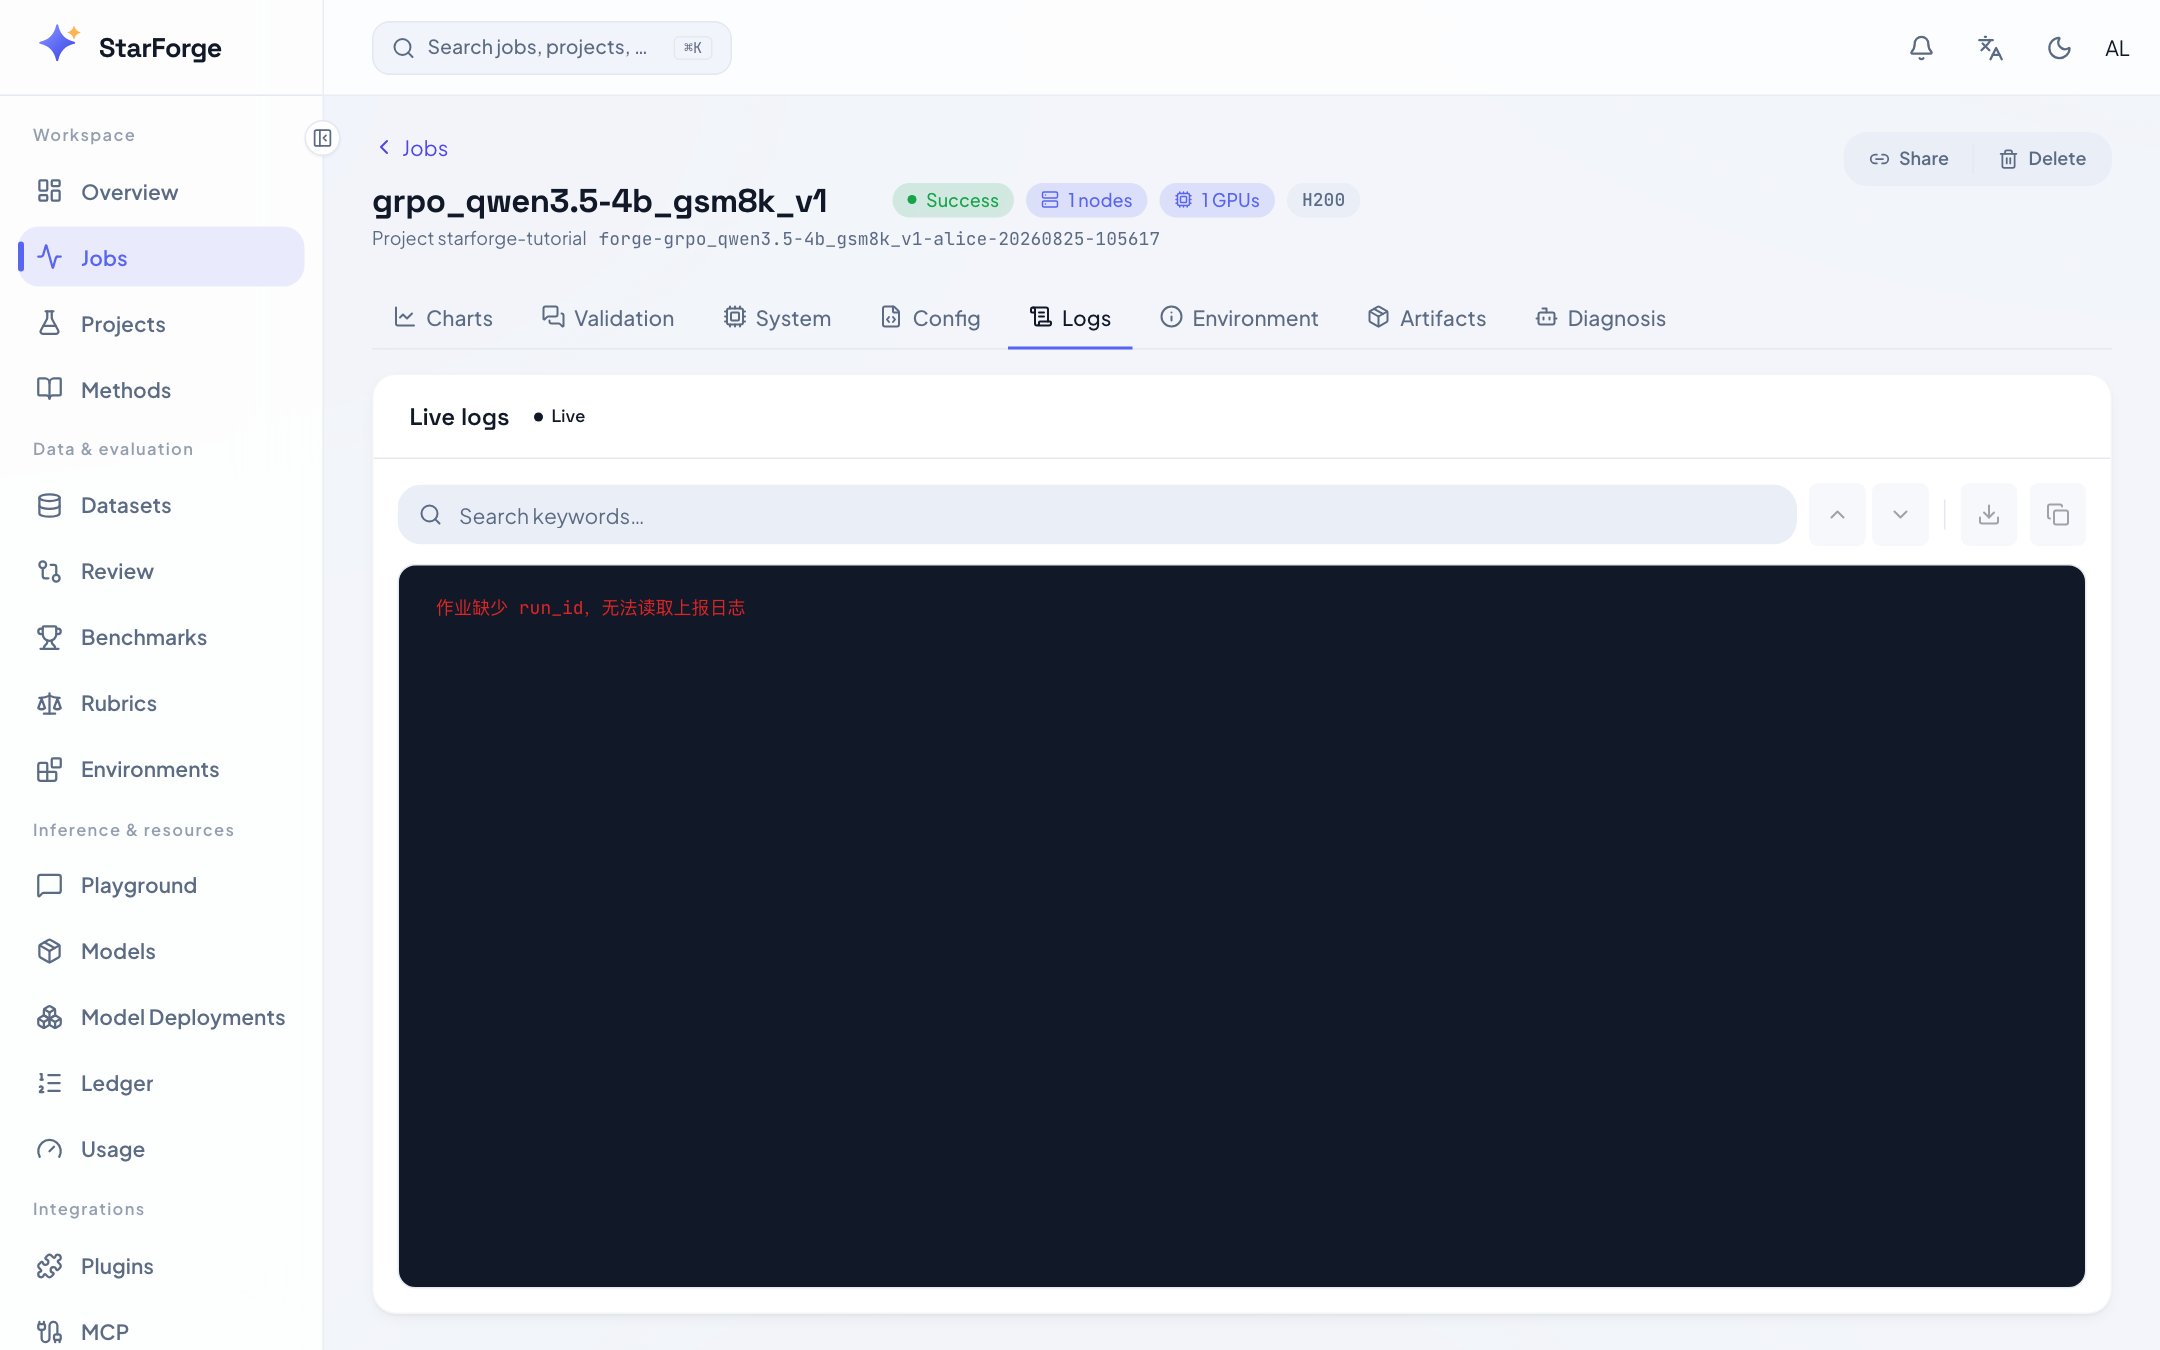
Full log stream: live SSE follow while running (auto-resume on disconnect), historical window playback, full-text search, download. A ring buffer protects against extremely long logs, so the browser never gets dragged down.
### Logs
Full log stream: live SSE follow while running (auto-resume on disconnect), historical window playback, full-text search, download. A ring buffer protects against extremely long logs, so the browser never gets dragged down.
 ### Validation
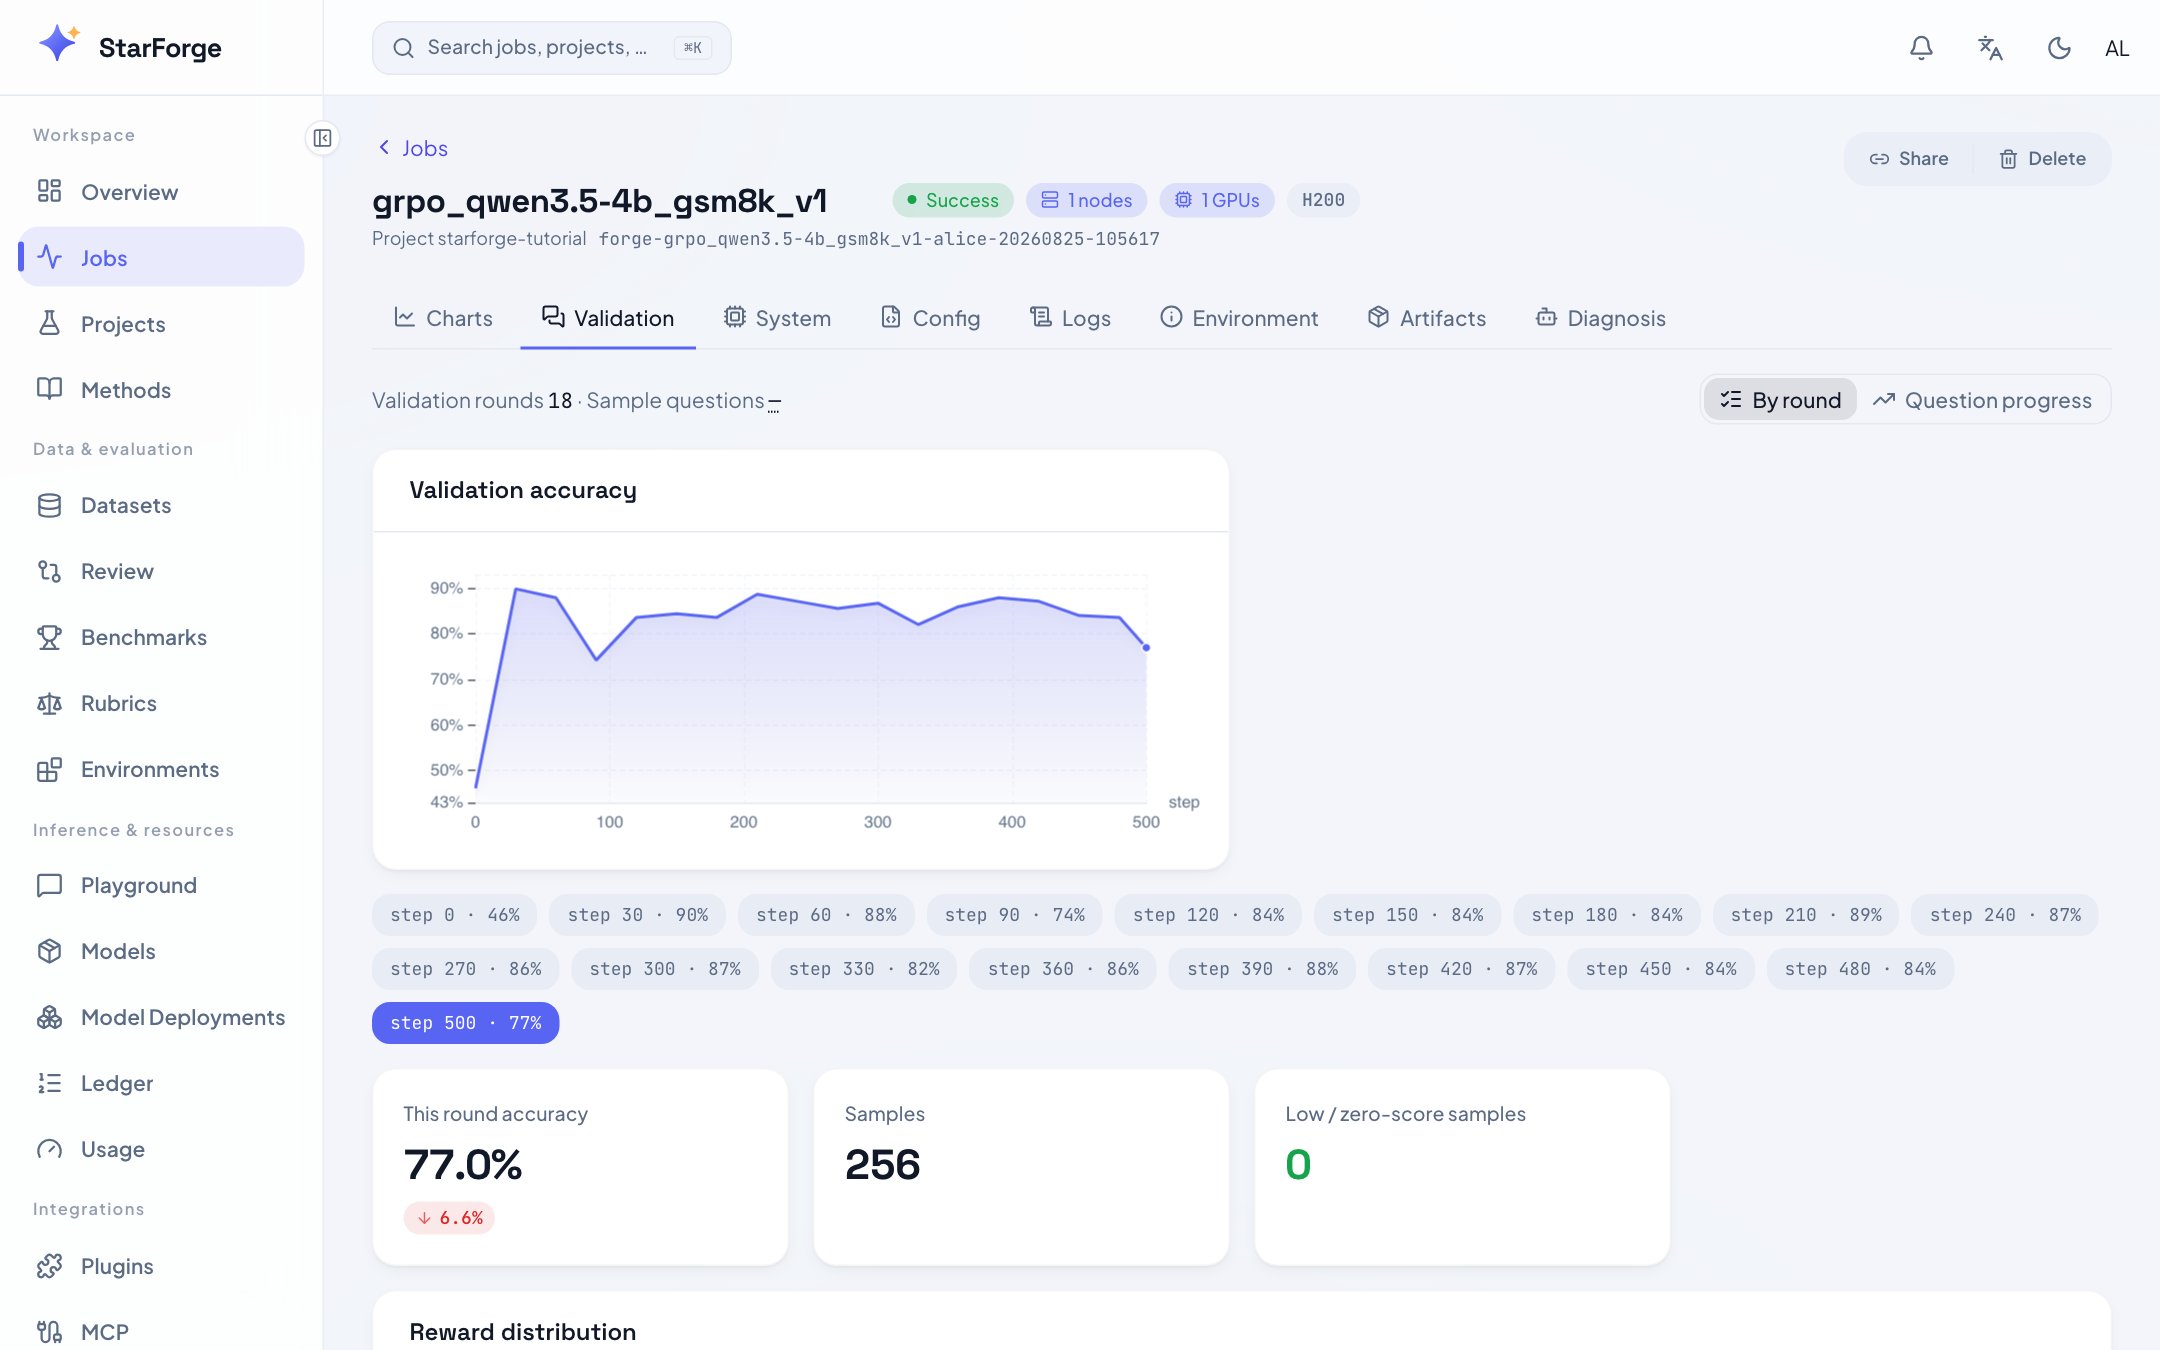
Per-round validation sample browsing: multi-turn conversation traces, reward distributions, comparison with the previous round. For RL methods, per-sample reward breakdowns are visible.
### Validation
Per-round validation sample browsing: multi-turn conversation traces, reward distributions, comparison with the previous round. For RL methods, per-sample reward breakdowns are visible.
 ### System
Hardware time series: GPU utilization, memory, temperature, network throughput. The first place to check whether "training is slow" is a data bottleneck or a communication bottleneck.
### Diagnostics
AI diagnostics: on failure, or on demand. It reads the log tail, metric trends, validation samples, and the config snapshot, then suggests knobs (including a resubmit plan).
### Lineage / Artifacts
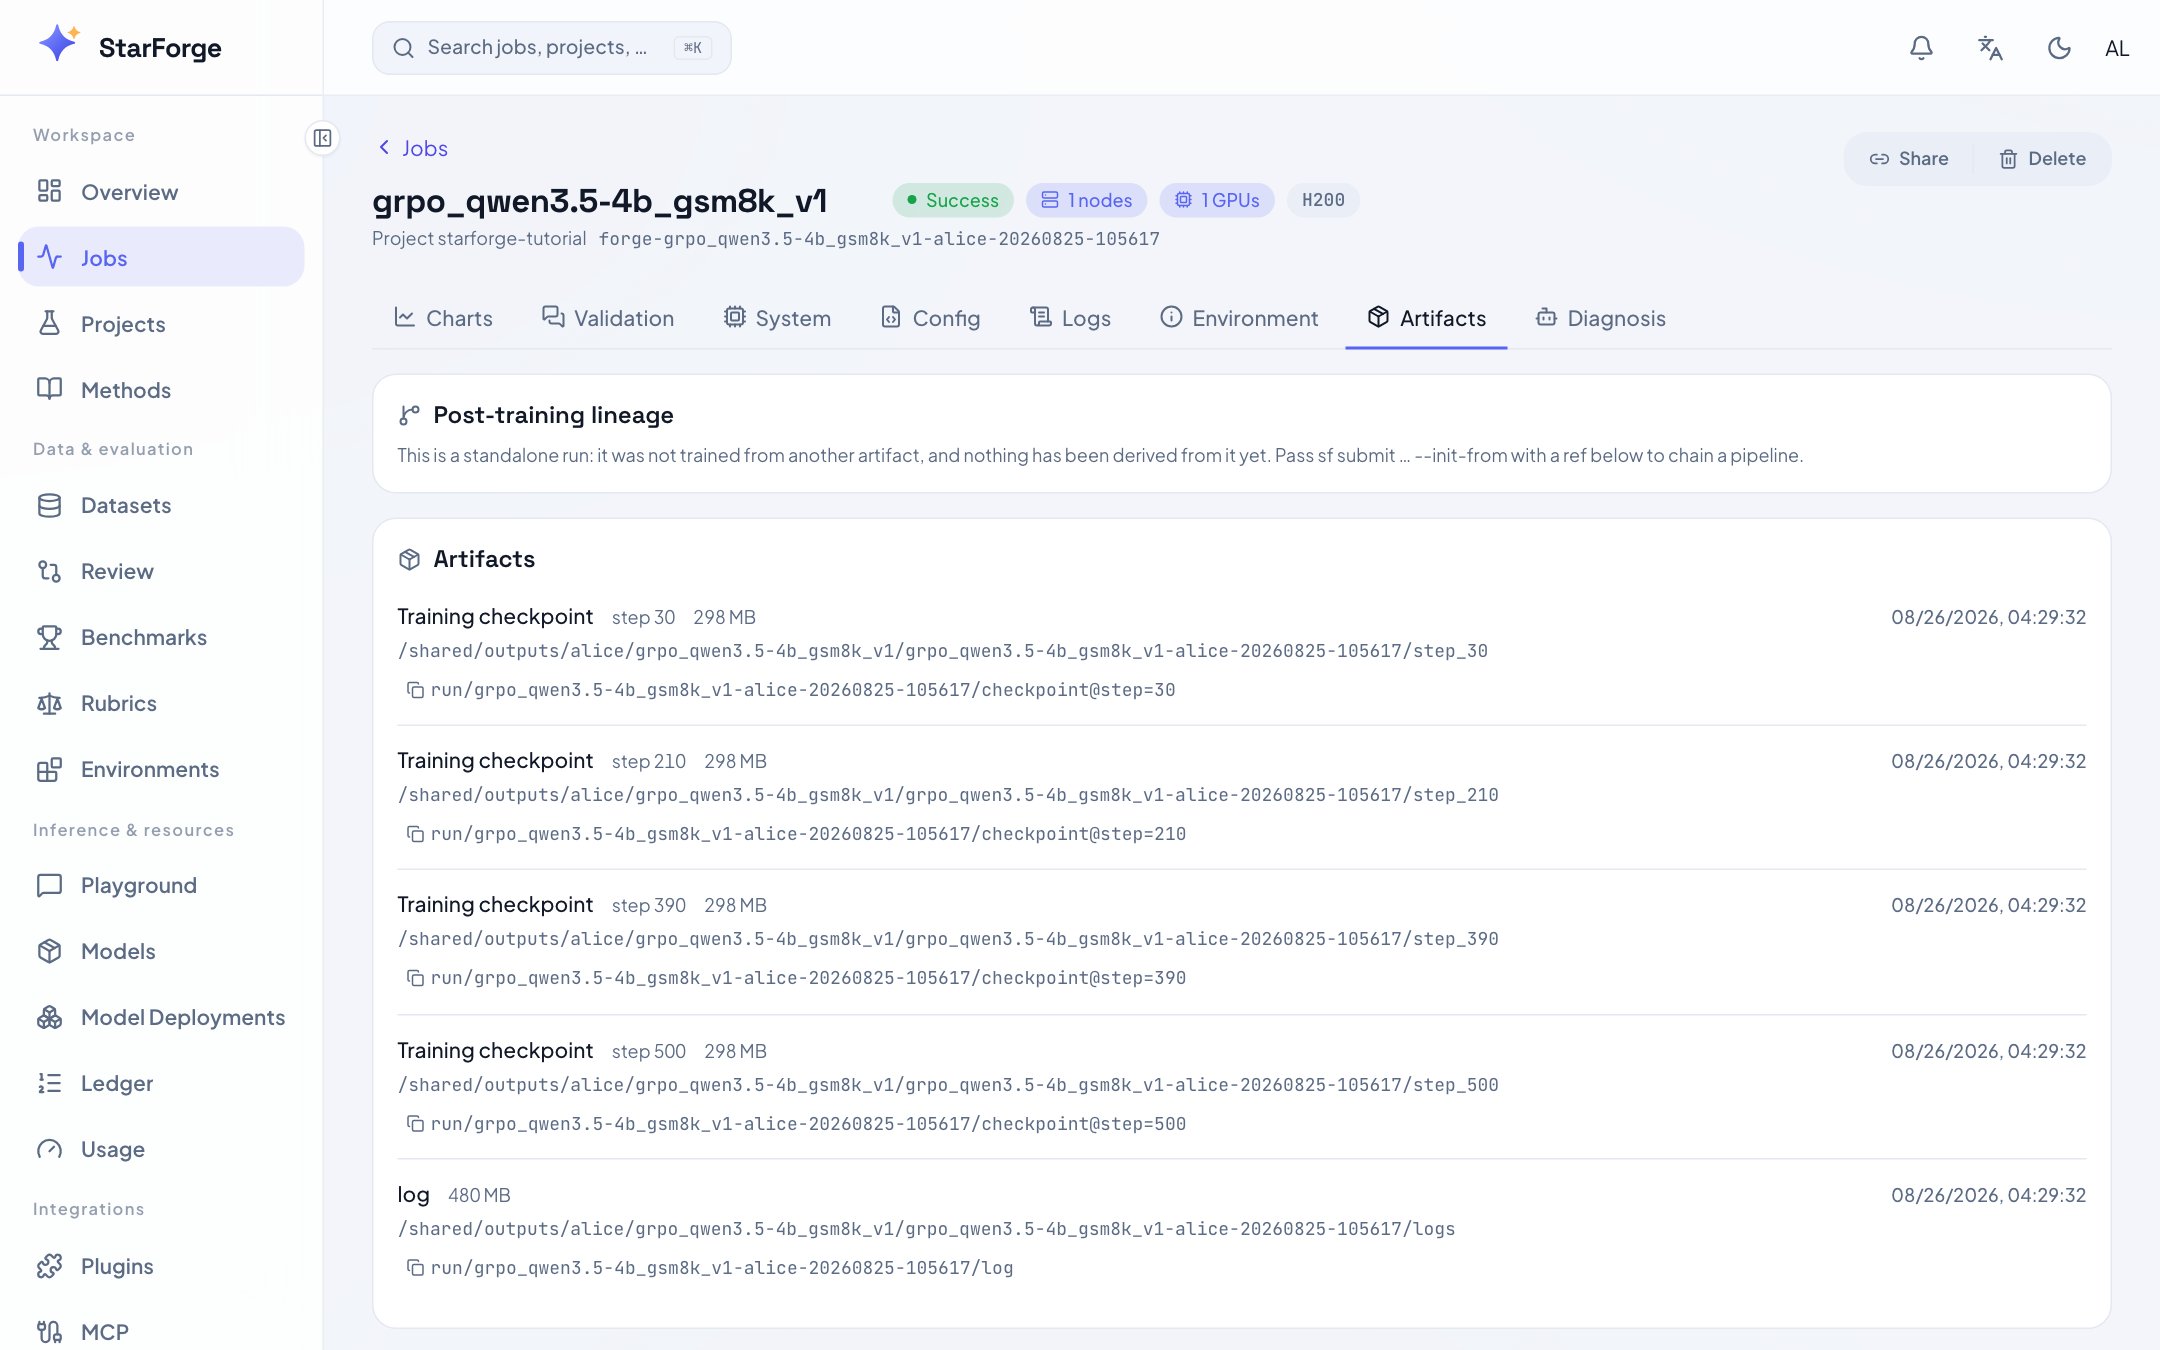
Checkpoints / hf\_exports / evaluation reports registered by this run, plus the upstream/downstream chain via `--init-from`.
### System
Hardware time series: GPU utilization, memory, temperature, network throughput. The first place to check whether "training is slow" is a data bottleneck or a communication bottleneck.
### Diagnostics
AI diagnostics: on failure, or on demand. It reads the log tail, metric trends, validation samples, and the config snapshot, then suggests knobs (including a resubmit plan).
### Lineage / Artifacts
Checkpoints / hf\_exports / evaluation reports registered by this run, plus the upstream/downstream chain via `--init-from`.
 ## Snapshots and comparison
Any job can generate a **share snapshot** (read-only link); comparing multiple runs happens on the [Review page](/en/console/review).
## Snapshots and comparison
Any job can generate a **share snapshot** (read-only link); comparing multiple runs happens on the [Review page](/en/console/review).