> ## Documentation Index
> Fetch the complete documentation index at: https://starforge.mintlify.site/llms.txt
> Use this file to discover all available pages before exploring further.
# Usage and quota
> What you are holding now, what you have spent, and where the GPU-hours went.
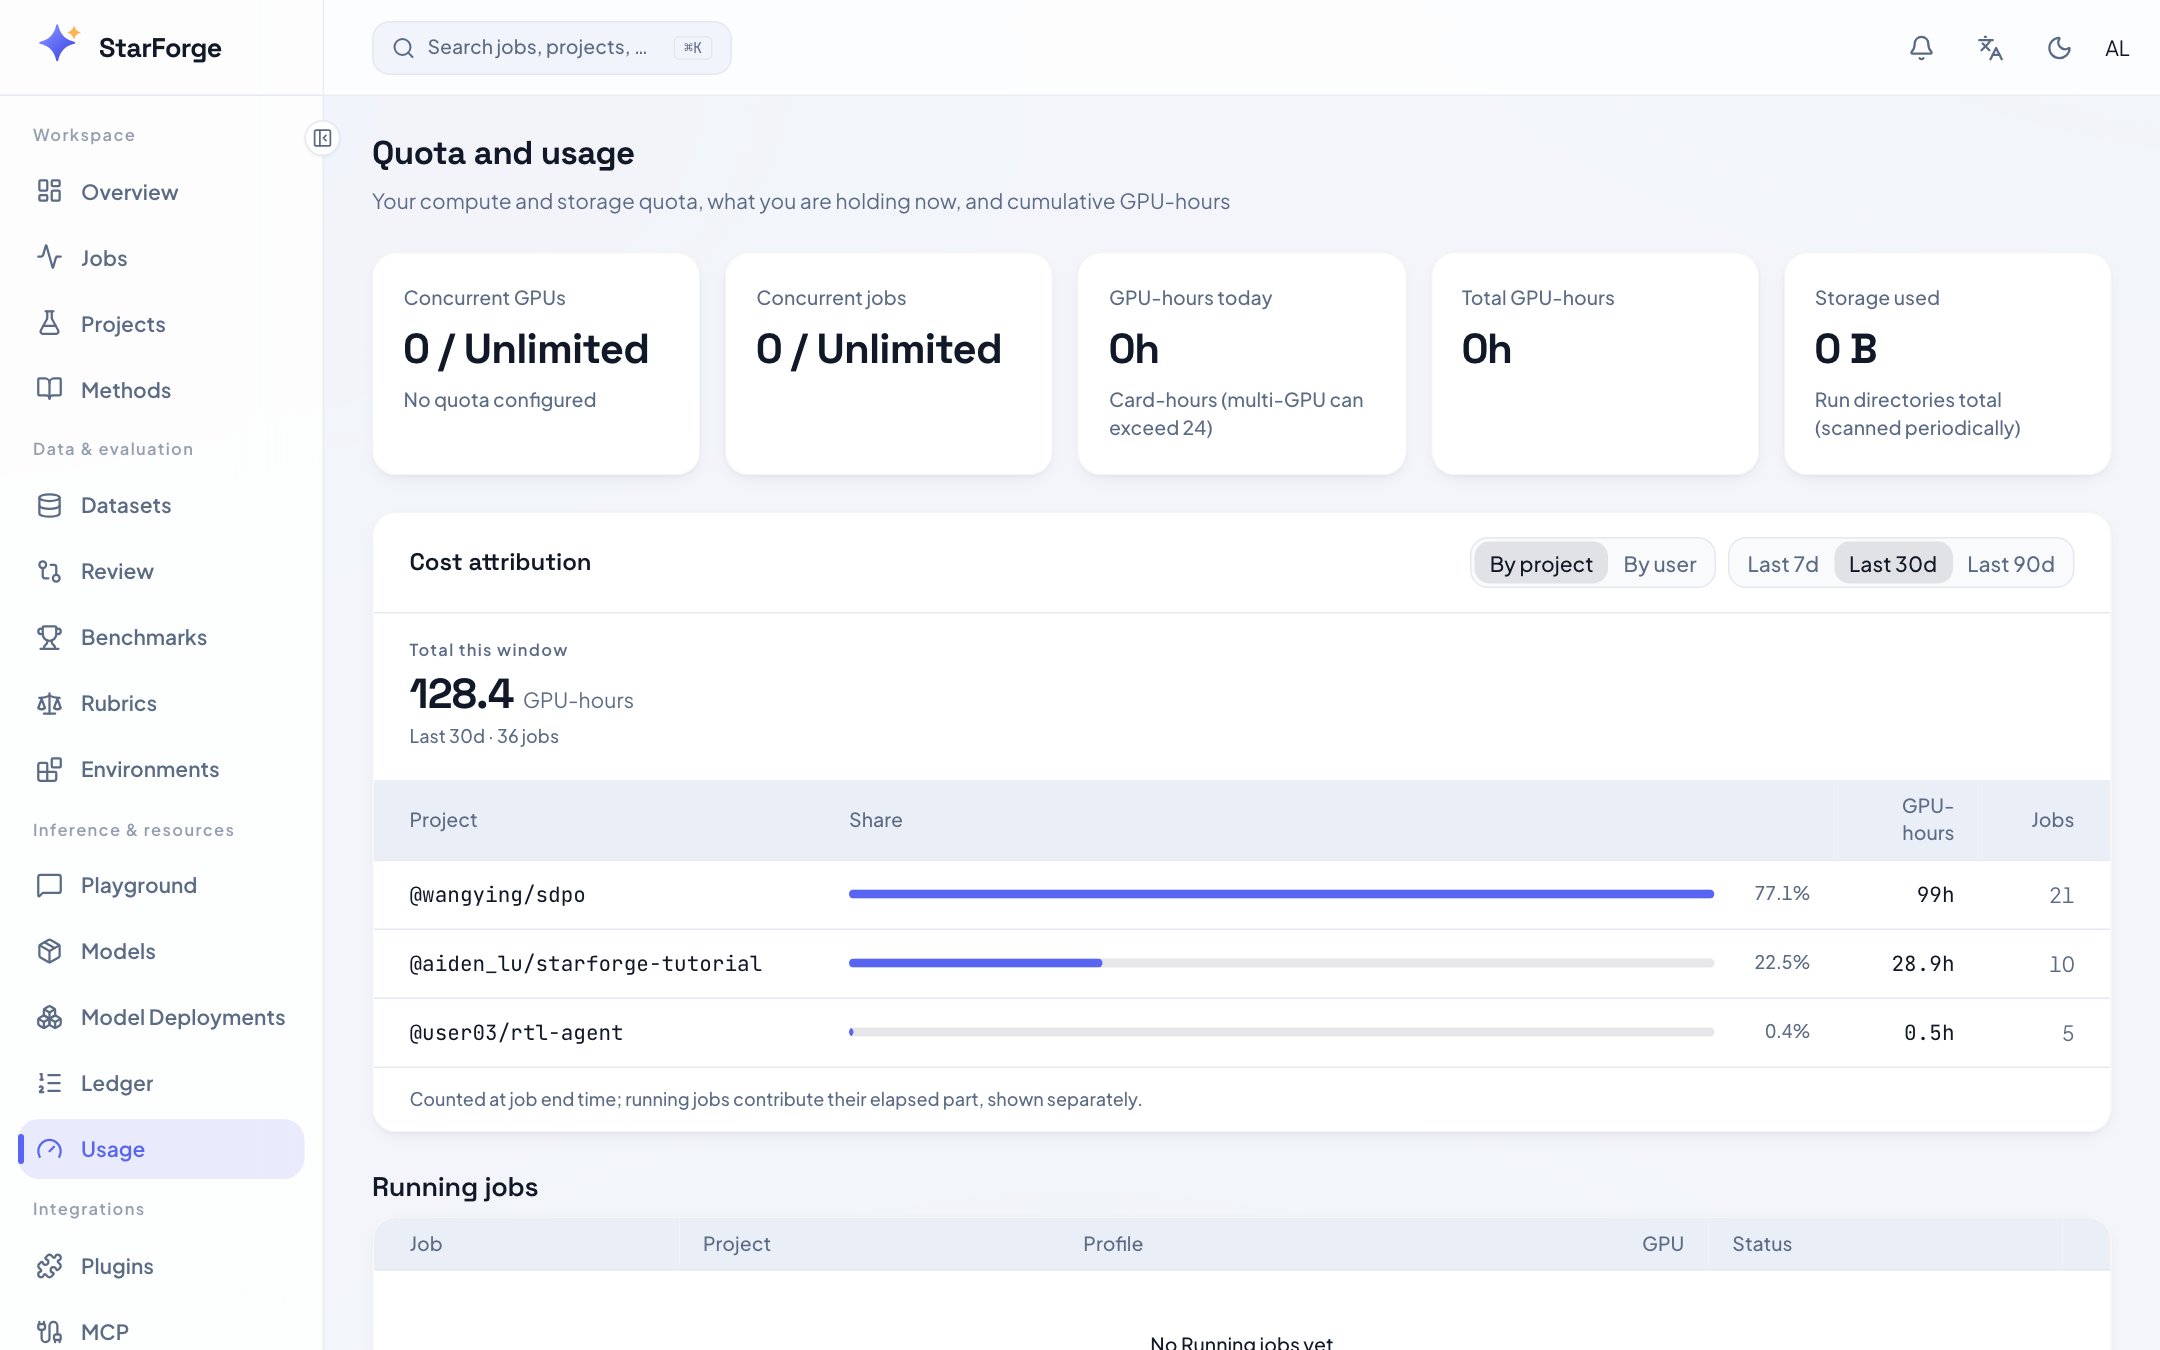 ## What you see
| Region | What it shows |
| -------------------------- | ------------------------------------------------------------ |
| **Concurrent GPUs / jobs** | What you are holding right now against your limits |
| **GPU-hours today** | Today's consumption, against a daily budget if one is set |
| **Storage** | Bytes under your run directories, against your storage quota |
| **Cost attribution** | GPU-hours grouped by project or by user over a time range |
## How the hours are counted
Attribution is counted **at job end**, and a running job contributes its elapsed portion so far. That
is why the numbers move during the day and settle overnight, and why a long run appears to grow
rather than landing all at once.
The billing clock starts when training actually begins — the `running` lifecycle mark — not when the
executor reports the container as up. The gap between the two is building a virtualenv and pulling
weights, which can be several minutes and is not training. Charging for it would systematically
overcount, and would penalise exactly the jobs on the slowest network links.
## What you can do
* Switch attribution between **by project** and **by user**.
* Change the time range.
* Follow a project through to its [project page](/en/console/projects).
## When you are refused despite free GPUs
Three different limits refuse for three different reasons, and the message says which:
| Limit | Meaning |
| --------------------- | -------------------------------------------------------------------------------- |
| **Concurrent GPUs** | You are already holding your maximum. Finish or stop something |
| **Storage quota** | Your run directories are over budget. `sf clean` an experiment you have exported |
| **Scheduling window** | This GPU series is outside its permitted hours right now |
None of these is the cluster being full. A cluster-full refusal says so, and the scheduler will
eventually [reserve capacity](/en/console/admin-settings) for a job that has been starved too long.
## What you see
| Region | What it shows |
| -------------------------- | ------------------------------------------------------------ |
| **Concurrent GPUs / jobs** | What you are holding right now against your limits |
| **GPU-hours today** | Today's consumption, against a daily budget if one is set |
| **Storage** | Bytes under your run directories, against your storage quota |
| **Cost attribution** | GPU-hours grouped by project or by user over a time range |
## How the hours are counted
Attribution is counted **at job end**, and a running job contributes its elapsed portion so far. That
is why the numbers move during the day and settle overnight, and why a long run appears to grow
rather than landing all at once.
The billing clock starts when training actually begins — the `running` lifecycle mark — not when the
executor reports the container as up. The gap between the two is building a virtualenv and pulling
weights, which can be several minutes and is not training. Charging for it would systematically
overcount, and would penalise exactly the jobs on the slowest network links.
## What you can do
* Switch attribution between **by project** and **by user**.
* Change the time range.
* Follow a project through to its [project page](/en/console/projects).
## When you are refused despite free GPUs
Three different limits refuse for three different reasons, and the message says which:
| Limit | Meaning |
| --------------------- | -------------------------------------------------------------------------------- |
| **Concurrent GPUs** | You are already holding your maximum. Finish or stop something |
| **Storage quota** | Your run directories are over budget. `sf clean` an experiment you have exported |
| **Scheduling window** | This GPU series is outside its permitted hours right now |
None of these is the cluster being full. A cluster-full refusal says so, and the scheduler will
eventually [reserve capacity](/en/console/admin-settings) for a job that has been starved too long.